The Science Behind Satellite-Based Air Quality Monitoring
By Ben Moose, Gasp Spring Intern
In my last blog post, I provided an overview of the concept, methods, advantages, and disadvantages of remote atmospheric monitoring. In this post, I will describe, in more detail, the techniques satellites use to detect air quality – how instruments can measure the concentration of gases and pollutants remotely. I will focus specifically on the TROPOMI device to illustrate the capabilities and recent advancements in the field, as it is one of the newest and most effective devices for air quality measurements.
How does TROPOMI measure pollutants?
As noted in my last post, TROPOMI allows beams of light reflected off of the atmosphere to enter the device. Instruments in the device then determine the wavelength of the measured light using wavelength detectors. As different gases in the atmosphere absorb light at different wavelengths, TROPOMI can determine the concentration of different gases in the atmosphere by comparing the wavelengths of reflected light to sunlight. For example, ozone absorbs light energy at wavelengths of approximately 500 – 700 nanometers. TROPOMI compares a sample of light directly from the sun to a sample of light reflected through the atmosphere, and the difference in light energy at wavelengths of 500 – 700 nanometers illustrates the concentration of ozone in the atmosphere. This process is called spectrometry, and the instrument used in TROPOMI is a multispectral imaging spectrometer, as it can detect a variety of wavelengths of light across different spectrums.
Why is TROPOMI so useful compared to other satellites?
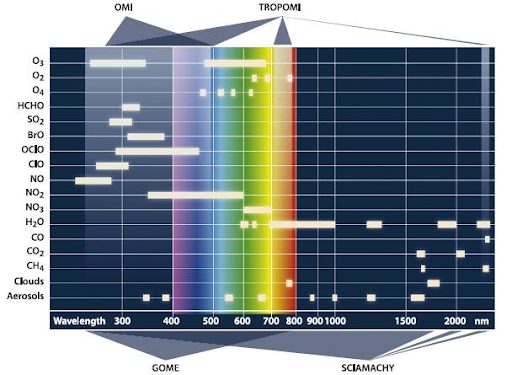
Range of measurement: TROPOMI, unlike other satellites used to detect air quality, can measure wavelengths in multiple different spectrums. Specifically, the device can detect wavelengths in the ultraviolet, visible, near-infrared, and short-wave infrared spectrums. TROPOMI’s access to a variety of different wavelengths allows it to simultaneously detect multiple gases that absorb different wavelengths of light, allowing the device to measure a wide range of pollutants and indicators of air quality that other devices cannot measure.  The image on the right illustrates TROPOMI’s measurement capabilities.
The bands of wavelengths at which different gases or pollutants absorb light energy are visualized with white bands on the chart, and the measurement abilities of different satellites are included at the top and bottom of the image. As shown in the chart, TROPOMI can detect substances in the atmosphere that absorb light at wavelengths of approximately 250-500 nm, 700-800 nm, and in a narrow band above 2000 nm.
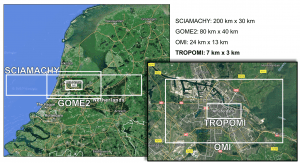
Accuracy and resolution: As the above visualization of the satellite ranges illustrates, other devices such as SCIAMACHY and GOME have very large ranges of wavelength detection, allowing these satellites to measure more indicators than TROPOMI. However, the main factor setting these devices apart is the resolution. While TROPOMI can measure pollutants and gases at a 7.0 km x 3 km resolution for most scans, SCIAMACHY’s resolution, for example, is about 200 km x 30 km. This huge difference in resolution allows the newer TROPOMI device to more accurately measure air quality with local measurements, despite its lack of ability to measure some air quality indicators. The visualization below illustrates the resolution of the four satellites included in the above chart, centered around the Amsterdam area.
Useful additional resources
This World Meteorological Organization site provides information about the different measurement capabilities of the TROPOMI device, as well as other satellite devices. It includes a list of different air quality and atmospheric indicators (gases, pollutants) and the satellite’s effectiveness at measuring each one, along with the measurement method.
This page of the Delft University of Technology’s website outlines the benefits of TROPOMI when compared to other satellites, and is the source of the images used in this post.


