
An Overview of Remote Atmospheric Monitoring
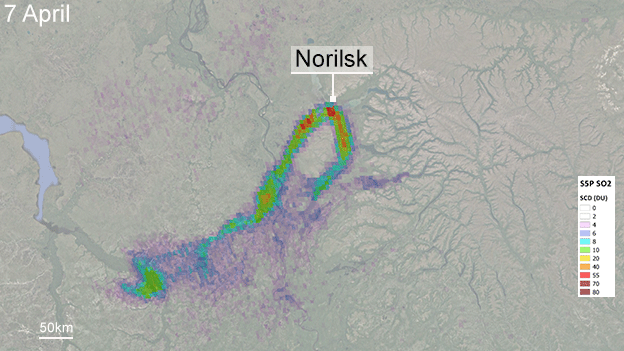
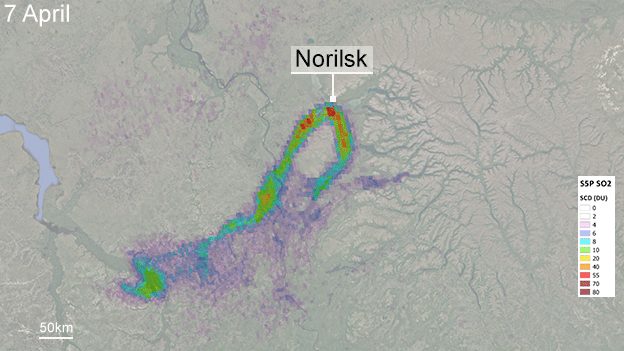
Data from the TROPOMI device illustrating the patterns of sulfur dioxide spread in Norilsk, Russia. Topography and wind speed as illustrated in the data overlay, have significant impacts of the spread of polluted air. Source: Jonathan Amos, BBC.
By Ben Moose, Gasp Intern
What is remote atmospheric monitoring?
Remote atmospheric monitoring, when used for air quality monitoring purposes, is the use of satellites and satellite instruments to determine the concentration of pollutants and other air quality indicators present in the atmosphere. One leading organization in the field of satellite air quality detection is the Copernicus Atmosphere Monitoring Service (CAMS). CAMS uses atmospheric computer-based models, along with satellite data and surface-based sensor data, to develop maps and measurements of global air quality. In order to collect satellite data, CAMS uses TROPOMI (Tropospheric Monitoring Instrument), a device on the Sentinel – 5P satellite which collects information about multiple air quality indicators and their atmospheric concentrations at an unprecedented resolution.
What are the advantages and disadvantages of remote air quality monitoring when compared to direct detection?
Accuracy – Although not as locally accurate as a surface-level air monitoring device such as those installed by the EPA around the country, TROPOMI can measure some air quality indicators such as sulfur dioxide at a 3.5km x 7km resolution, allowing for not just national, but regional and local air quality to be measured. This level of accuracy enables the detection of specific areas in which air quality issues need to be addressed. For example, TROPOMI data from Norilsk, Russia is shown in this image, illustrating the capability of the Sentinel – 5P satellite in terms of local air quality observation.
Cost – Although expensive to develop the equipment on the Sentinel – 5P satellite, TROPOMI allows for global atmospheric monitoring. On the other hand, EPA – installed local monitors can cost upwards of $10,000 just for sensors detecting one indicator, and can only gather data from a fixed location. Because of this cost difference, remote monitoring is the most efficient and practical method of gathering air quality data for most of the country and world, with a likely exception being urban areas with highly variable air quality based on specific location, time, or season.
Reliability – Many surface-based air quality monitoring sites do not regularly measure some air quality indicators. For example, the EPA network of sensors includes multiple devices in the Birmingham metropolitan area, but the most recent data points for many indicators such as sulfur dioxide are months in the past, so current air quality data is difficult to obtain. On the other hand, the Sentinel – 5P satellite, for example, is capable of measuring air quality data once every 24 hours for a given location, providing more recent data which is likely more accurate and useful for residents and organizations.
What services can use data from remote atmospheric monitoring systems?
The data gathered by TROPOMI and analyzed by CAMS is used to allow weather applications and services (such as the Weather Channel app) to provide local air quality information, either through combination with existing surface measurements or using satellite data alone. Remote atmospheric monitoring allows these applications to display up-to-date information on a variety of different air quality indicators that affect air quality indices, such as sulfur dioxide, ozone, and nitrogen dioxide.
Helpful resources
- Charts showing current air quality overlayed onto a visualization of the Earth. The data in these charts is obtained from the Sentinel-5P satellite and TROPOMI device.
- A page of TROPOMI’s website that gives an overview of the different indicators measured by the device, as well as links to data from the satellite and a more in-depth description of the measurement of each indicator.
- A BBC article describing the use of the Sentinel – 5P satellite to gather air quality data including an estimation of production of sulfur dioxide in Norilsk, Russia. The article provides examples of visualizations using TROPOMI data.
- A map of EPA air quality monitors with data about functionality and measurements, as well as the different types of indicators that each sensor measures.
- A World Meteorological Organization webpage that describes the methods in which the TROPOMI device measures different indicators of air quality, as well as the limitations of these measurements.
- A PDF file of the TROPOMI brochure with information about its measurement methods, construction, and functions.
Sources
http://www.aqmd.gov/aq-spec/home
https://www.spaceoffice.nl/files/documenten/16.0808%20Tropomi%20brochure%20ENG%203.pdf
https://www.wmo-sat.info/oscar/instruments/view/586
https://www.spaceoffice.nl/nl/activiteiten/nationaal-programma/nationale-projecten/tropomi/
https://www.bbc.com/news/science-environment-44705268
http://www.tropomi.eu/data-products/level-2-productsNorilsik
https://atmosphere.copernicus.eu/charts/cams
Header Image: PhysicsWorld, Photo credit: ESA/ATG medialab.

