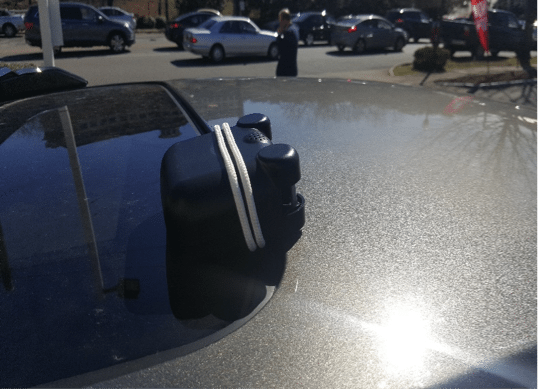
Once I was able to understand how to connect the AirBeam to my phone, and to input data into its open source map, AirCasting, I was finally able to test the pollution around Birmingham. To learn how to connect the AirBeam to your phone, and how to operate AirCasting, check out my previous blog post here.
The sunroof was closed almost completely shut, except for a tiny space to allow the rope to go through. This allowed the AirBeam to be securely placed at the top of my car. Sometimes the AirBeam would move around if I drove too fast, but for the most part, its movements were really small.
On one day of testing, I was driving a different car so the orientation of the AirBeam was standing up instead of lying down. The way and where exactly you decide to orient your AirBeam is up to you, as long as the intake and exhaust areas of the AirBeam are pointing to the outside. And if you decide to orient the AirBeam standing up, it’s better to flip the AirBeam so that the bottom of the AirBeam is in the direction of the wind. This will increase the accuracy of the data collected. It’s also important to remember that the AirBeam is not waterproof, so if it starts raining, you should take the AirBeam inside.
I decided to test the air quality close to three Birmingham city high schools: Mountain Brook, Homewood, and Jackson-Olin. The reason why I chose those three high schools is because they are in different areas in Birmingham, and each high school represents a different socio-economic bracket. I did not test the data on school grounds, because it’s against the law unless consent is given by the schools, but I would park around a minute away from each high school and collect the data on a public road. I just wanted to emphasize that I am a law-abiding citizen, and that jail would seriously deter my plans to graduate college in 2018.
In order to get the most accurate results, I decided that it would be best to test the air quality on three different days, using the same path each day, and starting the testing around the same time. I also tried my best to avoid highways, because I wanted to collect data in areas that were in close proximity to people that were outside.
I created a sheet that helped me organize the data collected. If you would like to conduct your own data collection study, you can print this sheet out.
The weather on the three days I tested were, coincidentally, quite different. On the first day of testing, I unfortunately forgot to take a pic near my first site, Mountain Brook High School, but I was able to take pictures of my other two stops.
For Jackson-Olin High School, AirCasting was not displaying the air pollutant data, only the decibel reading of the AirBeam’s microphone. After messing around with the maps and sensor data, I realized that no particulate matter readings were recorded, because only the sound sensor was working near Jackson-Olin High School.
[huge_it_slider id=”1″]
Note: Although only three days of data are mentioned in this article, I actually tried to collect data on more days. For example, on one extremely cloudy day, it started raining after I collected data near Mountain Brook. The data was still collected and used as an average for Mountain Brook. I tried to delete it from AirCasting, but I realized that it does not let you delete any of the data once it has been sent to CrowdMap. I initially tried to make the number of testing days equal for all three high schools, but some unforeseeable circumstances has allowed some high schools to have more data than others.


