RELATED: Read Gasp’s press statement on the 2016 State of the Air Report
The Birmingham-metro area received its best rankings ever in the report for both ozone and particle pollution. Birmingham ranked 22nd in year-round particle pollution and did not crack the top 25 for ozone days or short-term particle pollution this year.

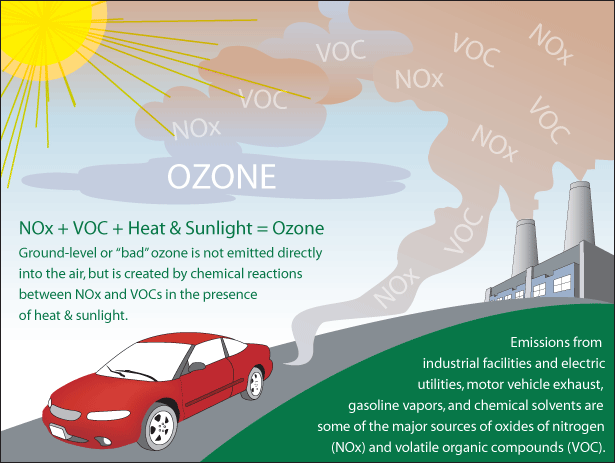
Ground-level ozone is formed when emissions from factories, power plants, and vehicles react to sunlight.
Ozone is a gas molecule made up of three oxygen atoms. Ground-level ozone pollution is created when nitrogen oxide (NOx) and volatile organic compounds (VOCs) emissions react to sunlight. Sources of NOx and VOCs include cars, power plants, factories, and wood-burning stoves, among other sources. Ozone season in Alabama is from May–October.
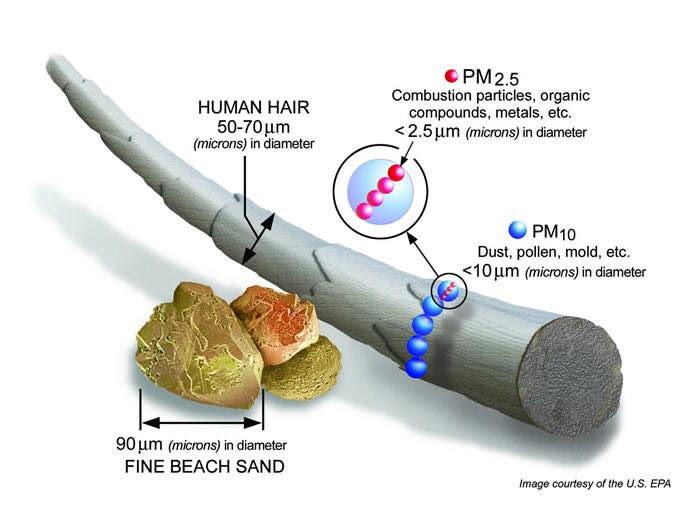
Particle pollution, or particulate matter, is a mixture of microscopic solid and liquid particles. These tiny particles come from numerous sources (a truck’s exhaust, a factory’s smokestack, etc.) and are extremely dangerous to your health. They are so small that they can get lodged in your lungs or make their way into your bloodstream.
Both ozone and particle pollution are linked to serious health risks. Extensive research has found links to increased risks of:
- asthma attacks
- heart attacks
- cancers
- coughing, wheezing and other breathing issues
- hospitalizations related to respiratory, cardiovascular, immune and neurological diseases
- reproductive health issues
- lower birth weight and/or pre-term birth
- premature death
People at Risk In 25 US Cities Most Polluted by Year-Round Particle Pollution
| No. | Metropolitan Area | Total Population | Pediatric Asthma | Adult Asthma | CV Disease |
|---|---|---|---|---|---|
| 1 | Bakersfield, CA | 874,589 | 22,811 | 47,274 | 39,611 |
| 2 | Visalia-Porterville-Hanford, CA | 608,467 | 16,490 | 32,302 | 27,286 |
| 3 | Fresno-Madera, CA | 1,120,522 | 28,482 | 61,434 | 54,190 |
| 4 | Los Angeles-Long Beach, CA | 18,550,288 | 391,452 | 1,093,121 | 981,745 |
| 5 | El Centro, CA | 179,091 | 4,527 | 9,863 | 8,897 |
| 6 | Modesto-Merced, CA | 798,350 | 19,952 | 44,214 | 39,399 |
| 6 | San Jose-San Francisco-Oakland, CA | 8,607,423 | 166,204 | 523,893 | 488,003 |
| 8 | Pittsburgh-New Castle-Weirton, PA–OH–WV | 2,653,781 | 55,262 | 210,546 | 218,588 |
| 9 | Harrisburg-York-Lebanon, PA | 1,239,677 | 29,398 | 95,249 | 94,211 |
| 10 | Louisville/Jefferson County-Elizabethtown-Madison, KY–IN | 1,498,593 | 35,700 | 134,900 | 132,990 |
| 11 | Cleveland-Akron-Canton, OH | 3,497,851 | 79,634 | 296,253 | 285,478 |
| 12 | Philadelphia-Reading-Camden, PA–NJ–DE–MD | 7,164,790 | 164,662 | 520,226 | 491,940 |
| 13 | Indianapolis-Carmel-Muncie, IN | 2,353,935 | 46,418 | 190,921 | 157,184 |
| 14 | Cincinnati-Wilmington-Maysville, OH–KY–IN | 2,208,450 | 55,681 | 186,179 | 168,576 |
| 14 | Altoona, PA | 125,955 | 2,803 | 9,732 | 10,387 |
| 16 | Houston-The Woodlands, TX | 6,686,318 | 126,257 | 322,667 | 362,663 |
| 16 | San Luis Obispo-Paso Robles-Arroyo Grande, CA | 279,083 | 4,486 | 17,852 | 18,081 |
| 16 | Lancaster, PA | 533,320 | 13,929 | 39,794 | 39,175 |
| 16 | Johnstown-Somerset, PA | 213,950 | 4,396 | 16,796 | 18,455 |
| 20 | Detroit-Warren-Ann Arbor, MI | 5,315,251 | 123,521 | 448,280 | 401,894 |
| 21 | Erie-Meadville, PA | 365,618 | 8,598 | 28,186 | 27,596 |
| 22 | Birmingham-Hoover-Talladega, AL | 1,317,269 | 40,271 | 96,700 | 119,939 |
| 23 | Little Rock-North Little Rock, AR | 902,443 | 19,823 | 60,518 | 83,498 |
| 23 | Fairbanks, AK | 99,357 | 2,205 | 5,999 | 3,875 |
| 23 | Wheeling, WV–OH | 145,205 | 2,779 | 12,814 | 15,016 |
Visit stateoftheair.org for more information.
Report air pollution here or by calling (205) 701-4277.


